Sartorius Shares
Global Stock Markets Post Price Gains
The world's major stock markets started off 2019 with strong price gains in the first quarter. Despite a weakening global economy and economic policy conflicts, such as the customs and trade disputes between the USA and China, share prices continued to rise further as the reporting year progressed. In particular, interest rate cuts by the U.S. Federal Reserve had a positive impact on stock markets. Supported by expansive monetary policy, the Dow Jones reached a new record high in the year under review. The leading German stock index DAX also soared in the fourth quarter, approaching its historical high and closing the reporting year at 13,249 points, up 25.5%. The MDAX and the German technology index TecDAX, to which the Sartorius preference shares also belong, saw a rise of 31.2% and 23.0%, respectively. The index relevant to the biotech industry, NASDAQ Biotechnology, achieved a gain of 24.4%.
Sartorius Shares Rise Substantially
The prices of both classes of Sartorius AG shares developed positively yet again. Contributing factors included better-than-expected business performance and announcement of two acquisitions. Sartorius preference shares closed the 2019 stock-market year at €190.80 – up 75.2% year over year. Ordinary shares closed around 82.3% higher, at €175.00.
Sartorius AG preference shares have been listed on the TecDAX since 2012 and were additionally admitted to the MDAX in September 2018. At the end of 2019, the company's share certificates on the MDAX ranked 11th in market capitalization (2018: 15th) and 26th in trading volume (2018: 32th). On the TecDAX, the rankings for Sartorius share certificates were 6th place for market capitalization (2018: 8th place) and 16th place based on trading volume (2018: 13th place).
Facts about the Shares
| ISIN | DE0007165607 (ordinary shares) |
| DE0007165631 (preference shares) | |
| Designated sponsor | Oddo Seydler Bank AG | M.M. Warburg & Co. (AG & Co.) KGaA |
| Market segment | Prime Standard |
| Indexes | MDAX | TecDAX | HDAX | CDAX | MSCI World | MSCI Europe | MSCI Germany | STOXX Europe 600 |
| Stock exchanges | Xetra | Frankfurt | Hanover | Dusseldorf | Munich | Berlin | Hamburg | Bremen | Stuttgart |
| Number of shares | 74,880,000 no-par individual share certificates with a calculated par value of €1 per share |
| Of which | 37,440,000 ordinary shares |
| 37,440,000 preference shares | |
| Of which shares outstanding | 34,212,224 ordinary shares |
| 34,176,068 preference shares |
Trading Volume and Share Price Development
| 2019 | 2018 | Change in % | |
| Preference share in € (Xetra year-end closing price) | 190.80 | 108.90 | 75.2 |
| Ordinary share in € (Xetra year-end closing price) | 175.00 | 96.00 | 82.3 |
| Market capitalization in millions of €1) | 12,507.9 | 7,006.1 | 78.5 |
| Average daily trading volume of preference shares | 65,810 | 107,761 | –38.9 |
| Average daily trading volume of ordinary shares | 1,238 | 2,153 | –42.5 |
| Trading volume of preference shares in millions of € | 2,682.6 | 3,571.1 | –24.9 |
| Trading volume of ordinary shares in millions of € | 45.7 | 61.3 | –25.4 |
| Total trading volume in millions of € | 2,728.3 | 3,632.4 | –24.9 |
| TecDAX (XETRA year-end closing price) | 3,014.9 | 1,960.7 | 53.8 |
| MDAX (XETRA year-end closing price) | 28,312.8 | 21,588.0 | 31.2 |
| DAX (XETRA year-end closing price) | 13,249.0 | 10,559.0 | 25.5 |
1) without treasury shares
Sources: Bloomberg, Deutsche Börse AG
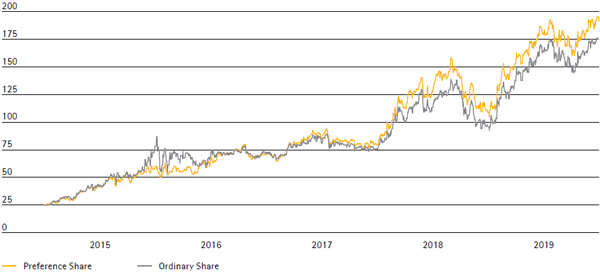
Sartorius Share1) in €
January 1, 2015 to December 31, 2019
1) Sartorius share prices from January 1, 2015, to June 13, 2016, adjusted for stock split
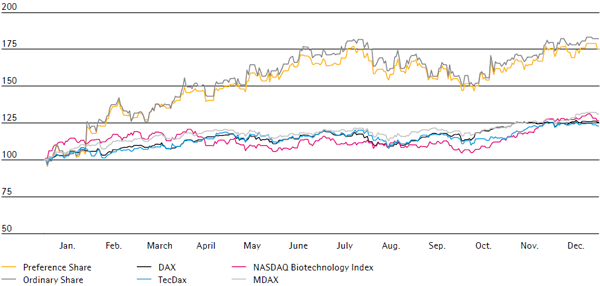
Sartorius Shares in Comparison to the DAX, MDAX, TecDAX and NASDAQ Biotechnology Index
January 1, 2019, to December 31, 2019
Market Capitalization and Trading Volume
The market capitalization of Sartorius AG ordinary and preference shares rose by around 79% in the reporting year and stood at €12.5 billion as of December 31, 2019, up from €7.0 billion in 2018.
The average number of preference shares traded daily on the Frankfurt Stock Exchange (Xetra and trading floor) decreased during the year under review from 107,761 to 65,810 shares. The high number in 2018 was essentially due to the admission of the company's preference shares to the MDAX and MSCI indices. Despite the higher share price level in the reporting period, the trading volume declined from €3.6 billion to €2.7 billion because admission to the latter indices had a one-time effect.
Due to the low free float of Sartorius’ ordinary shares, they are traded only to a limited extent. Thus, the average number of ordinary shares traded daily was 1,238 compared with 2,153 in the previous year. The corresponding trading volume was around €45.7 million (2018: €61.3 million).
Investor Relations
Sartorius investor relations activities follow the objective of making the current and future development of the company transparent for its stakeholders. To achieve this objective, Sartorius maintains an ongoing, open dialog with shareholders, potential investors and financial analysts.
Besides providing quarterly, first-half and annual reports, we inform the capital market and the interested public at quarterly teleconferences and in regularly published press releases about the current development of our business and other material events at the company. Moreover, Group management and our IR team were present for talks and factory tours with capital-market participants at our sites in Göttingen, Germany, and Aubagne, France. Management and IR specialists also took part at conferences and roadshows in various financial centers.
All information and publications about our company and its shares are available on our website at www.sartorius.com.
Analysts
The assessments and recommendations of financial analysts serve as an important foundation for the decisions of private and institutional investors when acquiring shares. During the reporting year, we maintained an ongoing dialog with a total of 19 institutes.
Research Coverage
| Date | Institute | Price target in € | Recommendation |
| Jan. 30, 2020 | Kepler Cheuvreux | 175.00 | Sell |
| Jan. 30, 2020 | J.P. Morgan | 235.00 | Buy |
| Jan. 30, 2020 | Nord LB | 150.00 | Hold |
| Jan. 30, 2020 | EQUI.TS | 132.00 | Hold |
| Jan. 29, 2020 | Deutsche Bank | 200.00 | Hold |
| Jan. 29, 2020 | M.M. Warburg | 206.00 | Hold |
| Jan. 29, 2020 | Janney | 225.00 | Hold |
| Jan. 26, 2020 | MainFirst | 245.00 | Buy |
| Jan. 20, 2020 | Commerzbank | 245.00 | Buy |
| Jan. 13, 2020 | Bank of America Merrill Lynch | 237.00 | Buy |
| Oct. 23, 2019 | Société Générale | 175.00 | Hold |
| Oct. 23, 2019 | AlphaValue | 163.00 | Sell |
| Oct. 23, 2019 | Metzler | 210.00 | Buy |
| Oct. 22, 2019 | DZ Bank | 139.20 | Sell |
| Oct. 16, 2019 | HSBC | 160.00 | Hold |
| Sep. 19, 2019 | LBBW | 200.00 | Buy |
| Aug. 23, 2019 | Hauck & Aufhäuser | 135.00 | Sell |
| Jul. 07, 2019 | UBS | 184.00 | Hold |
| Jun. 06, 2019 | Berenberg | 125.00 | Sell |
Dividends
The Sartorius Group strives to enable its shareholders to participate appropriately in the company’s success and has continuously raised dividends over the past years. Our dividend policy is basically oriented toward distributing an approximately stable share of relevant net profit (see definition on page 37) to our shareholders.
The Supervisory Board and the Executive Board will submit a proposal to the Annual Shareholders’ Meeting on March 26, 2020, to pay dividends of €0.71 per preference share and €0.70 per ordinary share for fiscal 2019.
If approved, the dividends would increase for the tenth consecutive year and the total profit distributed would rise considerably by 14.6%, from €42.1 million the previous year to €48.2 million. The corresponding dividend payout ratio would be slightly below the previous year's level at 23.0%. Based on the 2019 year-end prices, this would result in a dividend yield of 0.4% for ordinary shares (previous year: 0.6%) and 0.4% for preference shares (previous year: 0.6%). Treasury shares held by the company are not entitled to dividend payments.
Shareholder Structure
Sartorius AG’s issued capital comprises 37,440,000 million ordinary shares and the same number of preference shares, each with a calculated par value of €1 per share. A good 50% of the ordinary shares are held by the Sartorius families and are under the management of an executor. Approximately a further 5% are held directly by members of the Sartorius families, and some 9% are owned as treasury shares by the corporation itself. According to a mandatory announcement published in 2011, the U.S. company Bio-Rad Laboratories Inc. held approximately 30% of the ordinary shares at that time; based on the most recent information available, this company now holds around 34%. To our knowledge, the remaining approximately 2% of the ordinary shares are in free float.
Around 91% of Sartorius' preference shares are in free float; roughly 9% are held as treasury shares by the corporation.
Key Figures for Sartorius Shares1)
| 2019 | 2018 | 2017 | 2016 | 2015 | ||
| Ordinary shares2) in € | Reporting date | 175.00 | 96.00 | 75.42 | 72.80 | 78.50 |
| High | 176.00 | 139.00 | 89.41 | 87.50 | 78.50 | |
| Low | 92.60 | 76.80 | 73.66 | 54.50 | 24.63 | |
| Preference shares2) in € | Reporting date | 190.80 | 108.90 | 79.54 | 70.50 | 60.11 |
| High | 195.00 | 158.60 | 93.73 | 79.85 | 60.19 | |
| Low | 104.00 | 80.15 | 64.35 | 50.54 | 24.75 | |
| Market capitalization3) in millions of € | 12,507.9 | 7,006.1 | 5,298.7 | 4,900.1 | 4,740.1 | |
| Dividend per ordinary share4) in € | 0.70 | 0.61 | 0.50 | 0.45 | 0.38 | |
| Dividend per preference share4) in € | 0.71 | 0.62 | 0.51 | 0.46 | 0.38 | |
| Total dividends4) 5) in millions of € | 48.2 | 42.1 | 34.5 | 31.1 | 25.8 | |
| Payout ratio4) 6) in % | 23.0 | 24.0 | 24.0 | 23.5 | 24.0 | |
| Dividend yield per ordinary share7) in % | 0.4 | 0.6 | 0.7 | 0.6 | 0.5 | |
| Dividend yield per preference share7) in % | 0.4 | 0.6 | 0.6 | 0.7 | 0.6 |
1) Share prices and dividends for 2015 adjusted for stock split; rounded values
2) Xetra daily closing price
3) Without treasury shares
4) For 2019, amounts suggested by the Supervisory Board and the Executive Board of Sartorius AG
5) Calculated on the basis of the number of shares entitled to dividends; 2015 adjusted for stock -split
6) Based on the relevant net profit: net profit adjusted for extraordinary items and non-cash amortization, based on the normalized financial result, including the corresponding tax effects
7) In relation to the closing price in the year concerned